Cup and Handle Breakout Pattern : The Cup and Handle is a bullish continuation pattern that marks a consolidation period followed by a breakout. It was developed by William O’Neil and introduced in his 1988 book, How to Make Money in Stocks.
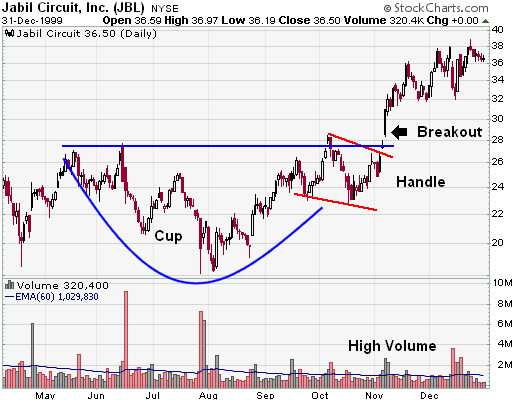
As its name implies, there are two parts to the pattern—the cup and handle. The cup forms after an advance and looks like a bowl or rounding bottom. As the cup is completed, a trading range develops on the right-hand side, and the handle is formed. A subsequent breakout from the handle’s trading range signals a continuation of the prior advance.

- Trend. To qualify as a continuation pattern, a prior trend should exist. Ideally, the trend should be a few months old. If the trend is too mature, the less chance of the pattern marking a continuation. In other words, there’s less upside potential.
- Cup. The cup should be “U” shaped and resemble a bowl or rounding bottom. A “V” shaped bottom would be considered too sharp of a reversal to qualify. The softer “U” shape ensures that the cup is a consolidation pattern with valid support at the bottom of the “U”. The perfect pattern would have equal highs on both sides of the cup, but this is not always the case.
- Cup Depth. Ideally, the depth of the cup should retrace 1/3 or less of the previous advance. However, with volatile markets and over-reactions, the retracement could range from 1/3 to 1/2. In extreme situations, the maximum retracement could be 2/3, which conforms with Dow Theory.
- Handle. Cup and Handle Breakout Pattern After the high forms on the right side of the cup, there is a pullback that forms the handle. Sometimes this handle resembles a flag or pennant that slopes downward; other times, it’s just a short pullback. The handle represents the final consolidation/pullback before the big breakout and can retrace up to 1/3 of the cup’s advance, but usually not more. The smaller the retracement, the more bullish the formation and significant the breakout. Sometimes it is prudent to wait for a break above the resistance line established by the highs of the cup.
- Duration. The cup can extend from one to six months, sometimes longer on weekly charts. The handle can be from one week to many weeks and ideally completes within one to fourweeks.
- Volume. There should be a substantial increase in volume on the breakout above the handle’s resistance.
- Target. The projected advance after breakout can be estimated by measuring the distance from the right peak of the cup to the bottom of the cup.
Cup and Handle Breakout Pattern
As with most chart patterns, capturing the pattern’s essence is more important than the particulars. The cup is a bowl-shaped consolidation, and the handle is a short pullback followed by a breakout with expanding volume. A cup retracement of 62% may not fit the pattern requirements, but a particular stock’s pattern may still capture the essence of the Cup and Handle.

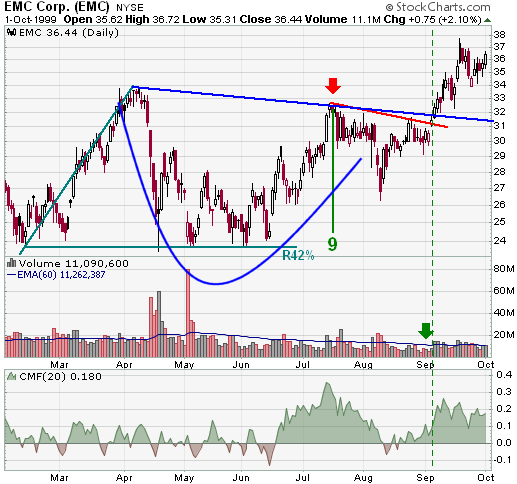
- Trend. EMC established the bull trend by advancing from 10 and change to above 30 in about 5 months. The stock peaked in March and then began to pull back and consolidate its large gains.
- Cup. The April decline was quite sharp, but the lows extended over a two-month period to form the bowl that marked a consolidation period. Also, note that support was found from the Feb-99 lows.
- Cup Depth. The low of the cup retraced 42% of the previous advance. After an advance in June and July, the stock peaked at 32.69 to complete the cup (red arrow).
- Handle. Another consolidation period began in July to start the handle formation. There was a sharp decline in August that caused the handle to retrace more than 1/3 of the cup’s advance. However, there was a quick recovery and the stock traded back up within the normal handle boundaries within a week. The essence of the formation remained valid after this sharp decline.
- Duration. The cup extended for about 3 months, while the handle extended for about 1 1/2 months.
- Volume. In early Sept-00, the stock broke handle resistance with a gap up and volume expansion (green arrow). In addition, Chaikin Money Flow soared above +20%.
- Target. The projected advance after breakout was estimated at 9 points from the breakout around 32. EMC easily fulfilled this target over the next few months.
Source: StockCharts
(Only the headline and picture of this report may have been reworked by the ShareMantras staff; the rest of the content is auto-generated from a syndicated feed.)