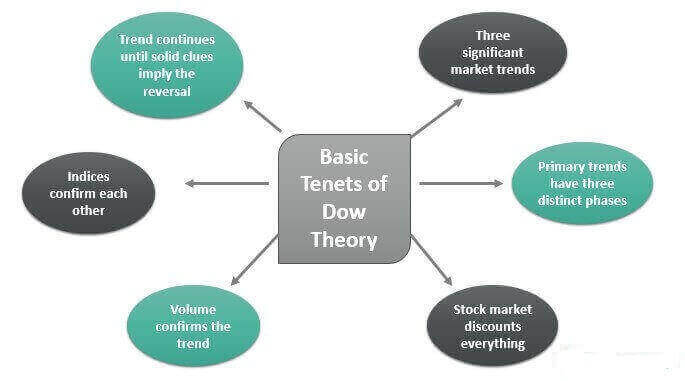
Dow Theory
1.The market has three movements : Dow Theory
(1) The “main movement”, primary movement or major trend may last from less than a year to several years. It can be bullish or bearish.
(2) The “medium swing”, secondary reaction or intermediate reaction may last from ten days to three months and generally retraces from 33% to 66% of the primary price change since the previous medium swing or start of the main movement.
(3) The “short swing” or minor movement varies with opinion from hours to a month or more. The three movements may be simultaneous, for instance, a daily minor movement in a bearish secondary reaction in a bullish primary movement.
2. Trends have three phases : Dow Theory
Dow Theory asserts that major market trends are composed of three phases: an accumulation phase, a public participation phase, and a distribution phase. The accumulation phase (phase 1) is a period when investors “in the know” are actively buying (selling) stock against the general opinion of the market. During this phase, the stock price does not change much because these investors are in the minority absorbing (releasing) stock that the market at large is supplying (demanding). Eventually, the market catches on to these astute investors and a rapid price change occurs (phase 2).
This occurs when trend followers and other technically oriented investors participate. This phase continues until rampant speculation occurs. At this point, the astute investors begin to distribute their holdings to the market (phase 3).
3.The stock market discounts all news : Dow Theory
Stock prices quickly incorporate new information as soon as it becomes available. Once news is released, stock prices will change to reflect this new information. On this point, Dow Theory agrees with one of the premises of the efficient market hypothesis.

4. Stock market averages must confirm each other : Dow Theory
In Dow’s time, the US was a growing industrial power. The US had population centers but factories were scattered throughout the country. Factories had to ship their goods to market, usually by rail. Dow’s first stock averages were an index of industrial (manufacturing) companies and rail companies. To Dow, a bull market in industrials could not occur unless the railway average rallied as well, usually first. According to this logic, if manufacturers’ profits are rising, it follows that they are producing more.
If they produce more, then they have to ship more goods to consumers. Hence, if an investor is looking for signs of health in manufacturers, he or she should look at the performance of the companies that ship the output of them to market, the railroads. The two averages should be moving in the same direction. When the performance of the averages diverge, it is a warning that change is in the air.
Both Barron’s Magazine and the Wall Street Journal still publish the daily performance of the Dow Jones Transportation Index in chart form. The index contains major railroads, shipping companies, and air freight carriers in the US.
5. Trends are confirmed by volume : Dow Theory
Dow believed that volume confirmed price trends. When prices move on low volume, there could be many different explanations why. An overly aggressive seller could be present for example. But when price movements are accompanied by high volume, Dow believed this represented the “true” market view. If many participants are active in a particular security, and the price moves significantly in one direction, Dow maintained that this was the direction in which the market anticipated continued movement. To him, it was a signal that a trend is developing.
6. Trends exist until definitive signals prove that they have ended : Dow Theory
Dow believed that trends existed despite “market noise”. Markets might temporarily move in the direction opposite to the trend, but they will soon resume the prior move. The trend should be given the benefit of the doubt during these reversals. Determining whether a reversal is the start of a new trend or a temporary movement in the current trend is not easy. Dow Theorists often disagree in this determination. Technical analysis tools attempt to clarify this but they can be interpreted differently by different investors.
Hope it help you all in making investment Decisions.
(Only the headline and picture of this report may have been reworked by the ShareMantras staff; the rest of the content is auto-generated from a syndicated feed.)